How to read the gold COT report like a technician
Every Friday at 3:30 PM Eastern, the CFTC publishes a report showing exactly where the biggest gold traders stand. Most retail traders have never opened it. They trade blind into positioning they could have seen coming.
This week gold dropped about 2.5 percent, from near $4,383 down to $4,245. The COT report published Friday told the story before price did. Here is how to read it.
What the COT report actually is
The Commitments of Traders report breaks down open futures positions by trader type. For gold, the version that matters is the legacy futures-only report for COMEX gold. It lands every Friday and covers positions as of the previous Tuesday, so you are always reading a snapshot that is three days old. That lag is fine once you know what to look for.
There are three groups in the report:
- Non-commercials. Large speculators and funds. This is the money that moves price when it rushes in or out. This is the group I watch.
- Commercials. Producers and merchants hedging real business. They are almost always net short gold. That is their job, not a signal.
- Non-reportables. Small traders. Noise for our purposes.
The iReadPrice gold COT heatmap tracks the non-commercial group across 26 weeks, updated every Friday from live CFTC data.
How to read the heatmap, column by column
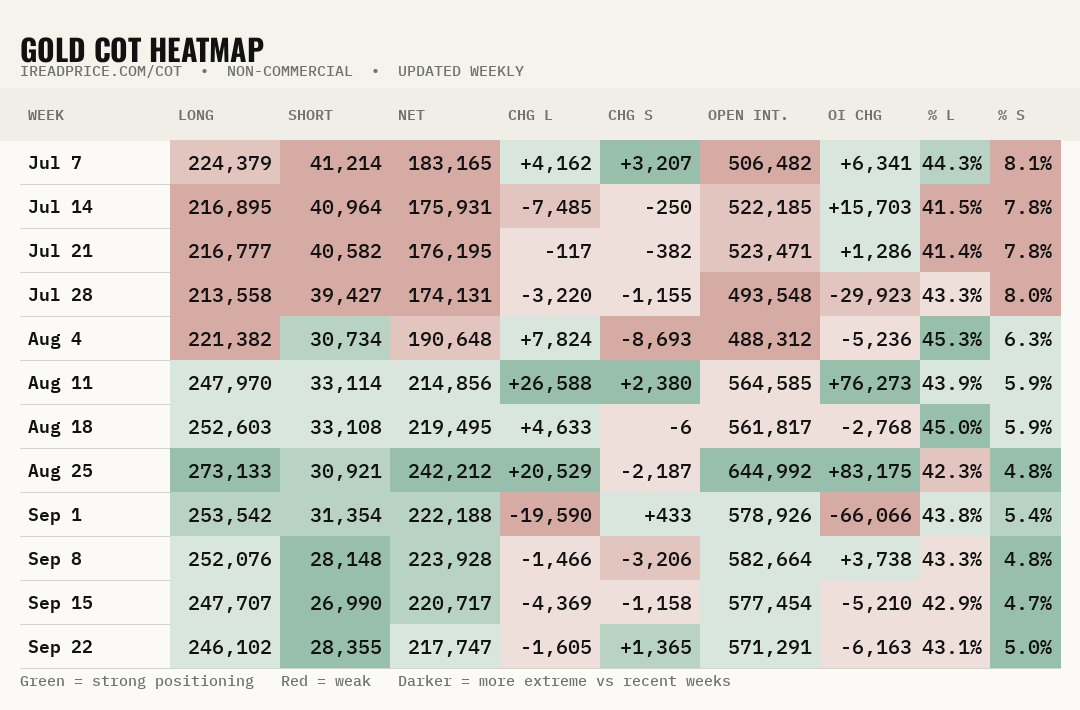
The live heatmap at ireadprice.com/cot. Green means strong positioning, red means weak, darker shades are more extreme compared with recent weeks. Tip: click any column header to sort the table, try sorting by open interest.
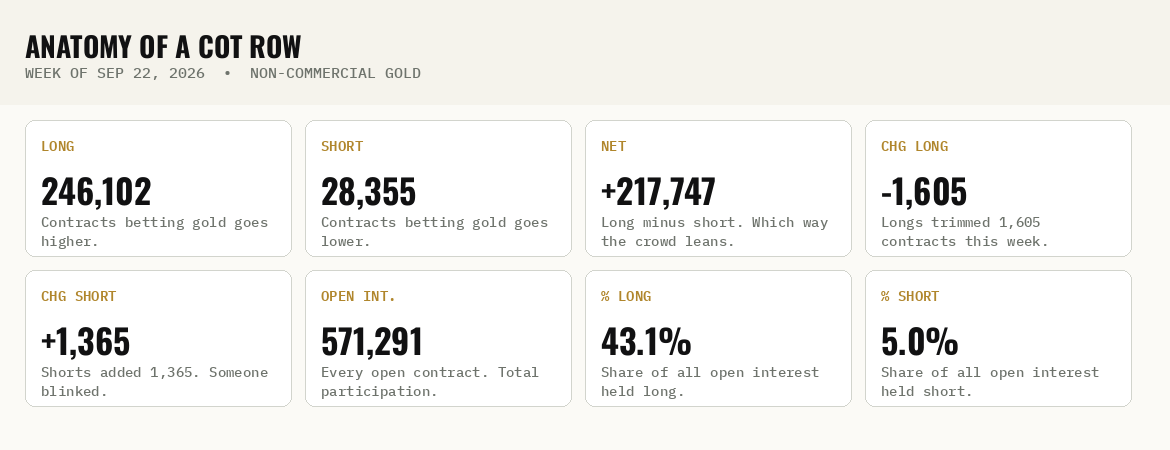
One row, decoded. These are the real numbers from the September 22 report.
- Week. The Tuesday the snapshot covers.
- Long / Short. Non-commercial contracts betting on higher or lower prices.
- Net. Long minus short. Positive means the crowd leans long.
- Chg Long / Chg Short. The week-over-week change. This is where the story lives.
- Open Int. Every open gold futures contract. Total participation.
- OI Change. Whether participation is growing or shrinking.
- % Long / % Short. Each side as a share of total open interest. Puts the raw numbers in context.
For shorts the color scale is flipped: heavy short positioning shows red, because crowded shorts are fuel for a squeeze the same way crowded longs are fuel for a flush.
The three reads that matter
1. Extremes. When net positioning stretches far in one direction, the trade is crowded. Crowded trades are fragile. You do not need a precise number, you need the shape: a steady climb in net longs over several weeks means late buyers are piling in at worse prices.
2. Weekly changes. A big swing in longs or shorts tells you who just blinked. Longs cut 19,590 contracts in a week is not background noise. That is funds heading for the exit.
3. Open interest. Rising open interest with rising price means new money coming in, healthy. Falling open interest into a selloff means longs giving up, a flush. Open interest confirms whether a move has participation behind it or is running on fumes.
This week's tape: what the data said first
Late August, specs were as long as they get. Net positioning hit +242,212 contracts, with 20,529 longs added in a single week and open interest up 83,175. The room was full.
First week of September, the unwind started: longs cut 19,590 contracts, open interest dropped 66,066. That happened while price still looked fine.
The September 22 report, published Friday September 25, showed more of the same: longs trimmed another 1,605, shorts added 1,365, net down to +217,747. Specs were lightening up into the top.
Then gold broke. It opened the week near $4,383.50, lost $4,300 on Wednesday, tagged about $4,245, and closed down roughly 2.5 percent. The drivers were macro: a hawkish Fed that had just hiked to 3.75 to 4.00 percent, the 10-year yield over 5.2 percent, and the dollar holding above 101.
Positioning did not predict the Fed. It showed the long side was already crowded, so when selling started there was nobody left to buy. That is the whole edge of this report: it tells you how much fuel is left in the tank.
The mistakes that cost people money
- Using COT for timing. It is positioning, not a trigger. It tells you the context around your levels, not when to click.
- Ignoring open interest. Price moving without participation is a rumor. Price moving with rising open interest is a commitment.
- Reading one week. One report is a photo. Twelve weeks is a film. Watch the trend in net and the changes.
- Forgetting the lag. The data is Tuesday's snapshot, published Friday. Use it for weekly context, not Monday's open.
FAQ
When is the COT report released?
Every Friday at 3:30 PM Eastern, covering positions as of the previous Tuesday. The iReadPrice heatmap refreshes Friday afternoon.
What does net positioning mean?
Non-commercial longs minus non-commercial shorts. Positive means large speculators lean long, negative means they lean short.
Is heavy net long positioning bullish or bearish?
It confirms the trend while it builds, but extremes warn the trade is crowded. When nearly everyone is already long, there is little buying power left and unwinds get violent.
Where can I see gold COT data without digging through CFTC files?
At ireadprice.com/cot: 26 weeks, color coded, sortable, updated every Friday from live CFTC data.
Does COT work for day trading?
No. It is a weekly positioning lens. Use it for swing context around your levels, not intraday entries.
Read this week's positioning
The heatmap is free and updates every Friday. Start with the data, then decide if you want the daily read.
Not financial advice. Positioning data describes futures traders, not future prices. Educational market commentary only.
Follow @ireadprice on X and Threads for more market breakdowns and trading related content.